Most dental conversion rate articles stop at one number: the share of visitors who fill in a form or tap the phone button. That number matters, but it is only half the story. A dental website does not get paid when someone calls. It gets paid when that caller ends up in the chair.
So this page looks at both halves. First, how often dental websites and dental ads turn visits into inquiries. Second, how often those inquiries turn into booked appointments, and why so many of them don’t. Put the two together and you can see where a practice is actually losing patients, which is usually not where it is spending money to fix things.
All figures below come from published benchmark reports. Where we combined them into our own model (the visitor-to-patient matrix and cost per booked patient), the method is shown so you can rerun it with your own numbers.
Request Dental SEO Quote
Key Dental Website Conversion Statistics at a Glance
| Statistic | Figure | Source |
|---|---|---|
| Median conversion rate of dental services landing pages | 4.3% | Unbounce Conversion Benchmark Report |
| Middle half of dental landing pages | 2.0% to 8.3% | Unbounce |
| Median landing page conversion rate, all industries | 6.6% (41,000+ pages, 57M+ conversions) | Unbounce via MarketingProfs |
| Dental Google Ads conversion rate | 9.08% | WordStream 2025 (16,446 US campaigns) |
| Dental Google Ads cost per lead | $83.93 | WordStream 2025 |
| Dental search ads conversion rate, newer data | 10.67% at $72.97 per lead | LocaliQ 2026 benchmarks |
| Dental new patient inquiries made by phone | 72.9% (forms 27.1%) | Liine Dentistry Benchmark Report 2024 |
| New patient inquiries that become a scheduled appointment | 57.1% | Liine, ~50,000 inquiries in 2023 |
| Booking rate gap between best and worst front-desk staff | 74.1% vs 25.5% | Liine (staff with 250+ new patient calls) |
| Lost bookings caused by insurance questions | 41.1% of recorded reasons | Liine, our grouping of its top 15 reasons |
| New-patient calls that go unanswered | 32% to 38% | Peerlogic |
| Private dental practices offering online scheduling | About 10% to 11% | Henry Schein One |
| Cosmetic and dental site conversion rate from organic search | 2.7% | Ruler Analytics, 2025 data |
Three Different Things People Call a Dental Conversion Rate
Before comparing your number to anyone’s benchmark, check which one you are measuring. Agencies quote all three, often without saying which.
- Site-wide conversion rate. Leads divided by all website sessions. Includes people looking for your address, existing patients paying a bill and job seekers. It is always the lowest number, often 2% to 3%.
- Landing page conversion rate. Leads divided by visits to one focused page, usually from an ad or a campaign. This is what Unbounce measures, and dental pages land at a 4.3% median.
- Ad conversion rate. Conversions divided by ad clicks, as Google Ads reports it. Dental sits around 9% to 11% here, partly because Google counts call extensions and tap-to-call actions that never touch the website.
A practice that compares its site-wide 2.5% to a 9% Google Ads benchmark will think its website is broken. It may be perfectly normal.

Dental Landing Pages Convert Below Average
Unbounce’s benchmark puts the healthcare median at 5.1%, and dental services is the only subcategory that falls below it, at 4.3%. Half of dental pages sit between 2% and 8.3%. Compared with the 6.6% median across all industries, the typical dental page loses about one in three of the leads an average landing page would get.
There are a few believable reasons. Dental visitors are often comparing several practices in different tabs. Many have an insurance question the page doesn’t answer. And a lot of dental pages are written to impress other dentists rather than a nervous patient. Unbounce’s medical practitioners analysis found dental copy uses dramatic, surprise-style language 61.8% more often than other medical pages, with no sign that it lifts conversions.
The same data has a more useful finding: reading difficulty barely hurts medical pages, and longer pages don’t convert worse once they pass 200 words. Patients will read when the topic is their own mouth. They just need the page to answer the question they arrived with.
Paid Clicks Convert Better, But Cost More
Dental search ads look strong on conversion: 9.08% in WordStream’s 2025 data and 10.67% in LocaliQ’s 2026 update, against all-industry averages of 7.52% and 8.18%. Someone typing “emergency dentist open now” is about as ready to act as a searcher gets.
The catch is price. Dental clicks cost $7.85 to $8.00, well above the $5.26 to $5.42 average, so the cost per lead ($72.97 to $83.93) still ends up higher than most industries. If you are deciding where the next dollar goes, our breakdown of SEO versus Google Ads spending covers when each one pays back.
| Metric | Dentists & Dental Services | All-industry average | Source |
|---|---|---|---|
| Click-through rate | 5.44% | 6.66% | WordStream 2025 |
| Cost per click | $7.85 | $5.26 | WordStream 2025 |
| Conversion rate | 9.08% | 7.52% | WordStream 2025 |
| Cost per lead | $83.93 | $70.11 | WordStream 2025 |
| Conversion rate | 10.67% | 8.18% | LocaliQ 2026 |
| Cost per lead | $72.97 | $66.69 | LocaliQ 2026 |
Conversion Rate by Traffic Source
Ruler Analytics tracks conversions across whole websites rather than single pages. In its 2025 data, cosmetic and dental sites converted best from direct visits (5.3%) and referrals (4.1%), and worst from social media (1.5%). Organic search converted at 2.7%.

Organic search looking weak here is a little misleading. Organic traffic includes people reading about tooth sensitivity at midnight with no plan to book anything. It brings volume and it builds the name recognition that later shows up as “direct” traffic. The two numbers belong together, not in competition.
Phone Calls Still Carry Most Dental Leads
Across nearly 50,000 new patient inquiries in 2023, Liine found 72.9% came in by phone and only 27.1% through online forms. Ruler’s 2026 health and social care data leans the other way (62.8% forms, 37.2% calls), which says a lot about dentistry: when it is your teeth, you still want to talk to a person.
This has a practical consequence. If your analytics only counts form submissions, it is ignoring roughly three quarters of your new patient demand. Call tracking with dynamic numbers is not a luxury for a dental site. Without it, your conversion rate is a guess.
Where Dental Leads Leak After the Click
Here is the part most website reports skip. Of every new patient inquiry Liine tracked, 57.1% turned into a scheduled appointment. The other 42.9% asked, and then didn’t book.
Phone handling makes the gap wider. Peerlogic reports that 32% of new-patient calls went unanswered in one analysis and 38% of inbound dental calls in another (4,280 calls across 26 practices). Even among answered calls, only 42% became appointments in its earlier dataset.
And the person answering matters enormously. Among staff who handled more than 250 new patient calls, Liine found the best booked 74.1% and the worst 25.5%. Same practice type, same phone, same website. Nearly three times the result.
Our Model: Booked Patients per 1,000 Visitors
To see how website conversion and front-desk booking interact, we multiplied Unbounce’s dental quartiles (2.0%, 4.3%, 8.3%) by Liine’s booking rates (25.5%, 57.1%, 74.1%). The result is the number of booked new patients from the same 1,000 visitors.

Two things jump out. The full range runs from 5.1 to 61.5 patients, a 12 times difference from identical traffic. And a median dental website with a strong front desk beats a top-quartile website with a weak one. Practices that pour money into a redesign while calls go to voicemail are fixing the smaller leak first.
Why Dental Inquiries Don’t Book
Liine recorded why inquiries ended without an appointment. We grouped its top 15 reasons into five buckets.

| Reason (Liine) | Share | Can the website prevent it? |
|---|---|---|
| Medicaid not accepted | 21.0% | Yes. State plainly which plans you take and which you don’t |
| Caller procrastination | 17.6% | Partly. Offer online booking and a reason to book now |
| Out-of-network insurance | 13.4% | Yes. Explain out-of-network costs and any membership plan |
| Scheduling issue | 12.0% | Partly. Show real available times online |
| Staff took a message | 7.1% | No. This is a phone process problem |
| Dropped call or hung up | 6.0% | Partly. A booking button gives impatient callers another route |
| Verifying insurance first | 6.0% | Yes. An insurance checker form or clear plan list |
| Treatment not offered | 4.8% | Yes. List services accurately, including what you refer out |
| Getting info for someone else | 3.7% | Partly. Pages written for parents and carers |
| Called wrong location | 2.0% | Yes. Clear location pages with separate numbers |
| Referral or records needed | 1.4% | Yes. Say upfront what new patients should bring |
| Price objection | 1.2% | Partly. Publish price ranges for common treatments |
| Location proximity | 1.1% | Yes. Show the map and service area early |
| Credit card not provided | 0.8% | No |
| Insurance info unavailable | 0.7% | Partly. Tell people what details to have ready |
Over half of these lost bookings are questions a good website could have answered before the phone rang. The insurance page is probably the most underrated conversion page on a dental site. Most practices bury it under a vague “we accept most major insurance” line, which is exactly what causes the call that ends in “sorry, we don’t take that one.”
There is another way to read this. A website that answers insurance questions clearly may get slightly fewer calls, but far more of them book. Fewer, better leads can lift both the booking rate and the front desk’s mood.
Online Booking: Wanted by Patients, Offered by Few
Henry Schein One says online scheduling adoption sits in the “low teens” across dentistry, about 10% to 11% for private practices, with group practices higher. Its own research found about 43% of patients do their searching after hours, when nobody is at the desk.
That gap is the opportunity. Dental Economics reports that 73% of patients book after hours when they are given the option, and the same article estimates an average phone scheduling call takes 8 minutes of staff time. In one Henry Schein One beta with a 145-location DSO, Reserve with Google drove over 700 new patient visits in about six weeks.
Online booking also quietly fixes several reasons in the table above: procrastination, scheduling issues and dropped calls. A patient who can see Tuesday at 4:30 is open is far less likely to “call back later”.
Speed and Mobile Still Decide the First Few Seconds
Most dental searches happen on phones. Unbounce found mobile sends about seven times more landing page traffic than desktop across health and wellness, while desktop visitors convert 22% better. That difference is usually a sign of friction on mobile, not of less interested people.
Speed is the most common friction. Google data has long shown that the chance of a mobile visitor bouncing rises 32% as load time goes from 1 to 3 seconds. Dental sites are often heavy with before-and-after galleries, video headers and chat widgets that all load at once. If your largest image is the slowest thing on the page, start with our guide on fixing LCP issues, and check that your host isn’t the bottleneck with this list of SEO-friendly hosting services.
What a Booked Patient Really Costs
Cost per lead is the number ad platforms show you. Cost per booked patient is the number your accountant cares about. To get it, divide cost per lead by your booking rate.
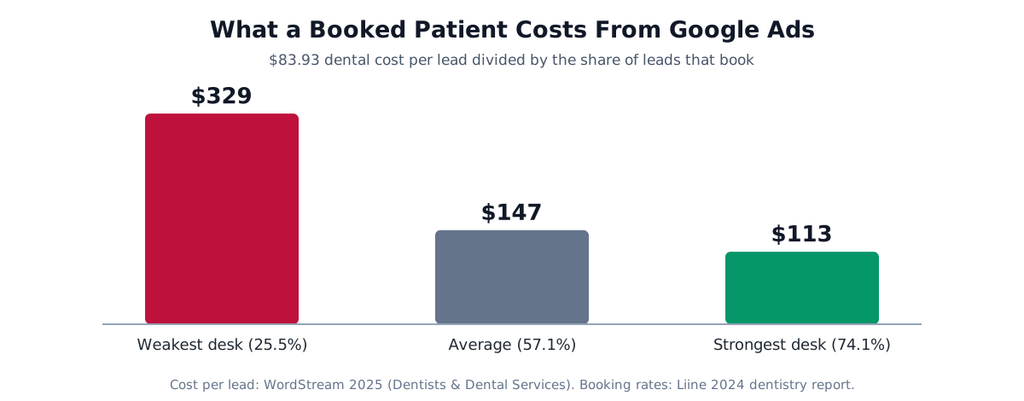
At WordStream’s $83.93 dental cost per lead, an average 57.1% booking rate means about $147 per booked new patient. Raise booking to the best staff rate of 74.1% and it drops to $113. Fall to 25.5% and it climbs to $329. Nothing about the ad changed.
These figures cover first appointments only. They don’t include patients who book and then don’t show, which is why tracking all the way to the completed visit gives the truest number.
What Is a Good Conversion Rate for a Dental Website?
Using Unbounce’s dental quartiles as the yardstick for focused landing pages, here is a simple way to judge where you stand. For site-wide rates, expect roughly half of these numbers.
| Landing page conversion rate | Where it puts you | Usual first fix |
|---|---|---|
| Below 2% | Bottom quarter of dental pages | Check tracking first, then speed and mobile layout |
| 2% to 4.3% | Below the dental median | Answer insurance, cost and availability on the page |
| 4.3% to 8.3% | Above median | Add online booking and test the offer |
| Above 8.3% | Top quarter | Focus on the booking rate and show-up rate instead |
Once you pass the median, the website is rarely your biggest problem. The 12 times spread in our model comes far more from what happens after the inquiry than from small gains in page conversion.
How to Measure Dental Website Conversions Properly
- Set up call tracking with dynamic numbers so phone leads are tied to the page and channel that produced them. Three quarters of new patient leads arrive by phone.
- Count form submissions and online bookings as separate key events in GA4. A booking is worth more than a contact form.
- Exclude existing patients where you can. Patient portal logins and bill payment visits inflate sessions and drag the rate down.
- Track the booking rate per staff member and per hour. Missed calls cluster at lunch and the last hour of the day.
- Log the reason for every inquiry that doesn’t book, using a short fixed list. That list will tell you which website pages to rewrite.
- Report cost per booked patient, not just cost per lead, every month.
Local visibility feeds all of this. If you want context on how patients find practices before they ever reach the site, these Google local SEO statistics are a useful companion.
Ways to Raise a Dental Website’s Conversion Rate
- Put insurance on the page that sells the treatment. A short “Plans we accept” block on implant, Invisalign and new patient pages, plus a clear line on Medicaid.
- Make the phone number tappable and sticky on mobile. Phone is still the main way dental patients convert.
- Offer online booking for new patient exams and emergencies. It captures the after-hours searcher and the patient who hates calling.
- Publish price ranges. Only 1.2% of lost bookings cite price directly, but many “I’ll call back” patients are quietly worried about cost.
- Build one page per location. Each with its own number, map and hours, so nobody calls the wrong office.
- Write for the anxious patient. Explain what happens at the first visit, how long it takes and whether it hurts. Medical readers will read long pages if they answer real questions.
- Cut the heaviest elements above the fold. Autoplay videos and large galleries can sit lower on the page.
- Train and monitor the front desk. Our model shows this can matter more than the website itself.
Frequently Asked Questions
What is the average conversion rate for a dental website?
Dental landing pages convert at a median of 4.3% according to Unbounce, with the middle half between 2% and 8.3%. Whole-site conversion rates are lower, usually around 2% to 3%, because they include visitors who were never going to book.
What is the average Google Ads conversion rate for dentists?
WordStream’s 2025 benchmarks put it at 9.08% with a $83.93 cost per lead. LocaliQ’s 2026 figures show 10.67% and $72.97.
Do dental patients prefer calling or booking online?
Most still call. Liine found 72.9% of new patient inquiries came by phone. But many patients search after hours, and when online booking is offered a large share of bookings happen outside office hours.
How many dental inquiries turn into appointments?
About 57.1% in Liine’s dataset of roughly 50,000 inquiries. Individual staff ranged from 25.5% to 74.1%.
Why do dental leads not book?
Insurance is the biggest reason. Medicaid not being accepted, out-of-network plans and insurance verification together account for about 41% of recorded reasons. Procrastination and scheduling problems come next.
Is a redesign the best way to get more dental patients?
Not always. If calls go unanswered or booking rates are low, fixing the phone process and the insurance information usually brings more patients than a new design.