
$152.79 per new patient. That was the organic search cost in the example practice we modeled. Four changes brought it down to $95.60, and only one of those changes added to the monthly bill.
So how do you reduce cost per patient through organic search? Book more patients from the visits you already get, then add traffic. The phone, the service pages and the Business Profile come first, because they cost little. New content comes last, because it costs the most per patient saved.
We built the model in Python and changed one input at a time, so you can see what each lever is worth. Every number in it is an example input that we picked to show the math. Swap in your own figures and the same code will give your practice’s answer.
Request Dental SEO Quote
Cost per Patient Numbers From Our Example Model
- Example organic cost per new patient at the start: $152.79, from a $3,000 monthly SEO cost.
- Answering 85% of new-patient calls in place of 70% cut it to $125.83 on its own.
- Lifting service page conversions from 4% to 5% cut it to $132.86.
- Adding 250 visits with new pages cost $400 more a month and cut it only to $148.42.
- With all four levers together, the example organic cost fell to $95.60 per new patient.
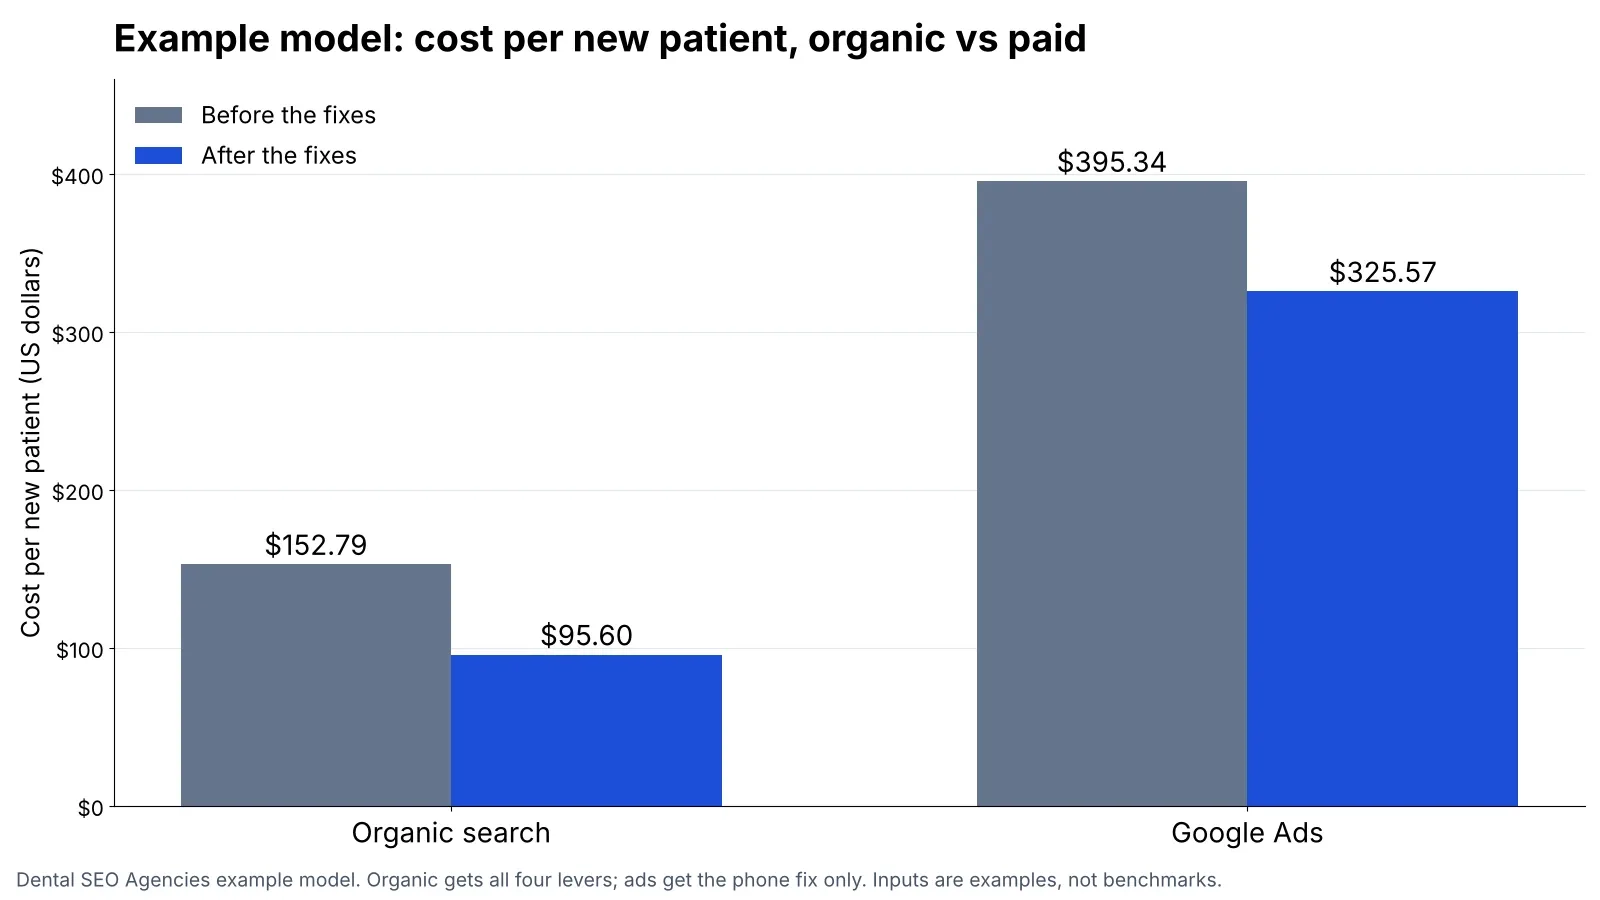
- The same phone fix took the example Google Ads cost per patient from $395.34 to $325.57.
Define Cost per Patient for Organic Search
Cost per patient from organic search is your monthly SEO cost divided by the new patients organic search brought in that month. Both halves need firm rules, or the number drifts from month to month.
On the cost side, include the agency fee, content and photo costs and staff hours spent on SEO. On the patient side, count only first-time patients who attended. Also leave out people who searched your practice name, because they were looking for you already. Our guide to calculating dental SEO ROI covers how to strip branded searches out.
Then break the patient count into steps. Each step is a place where patients leak, and each leak is a lever.
| Model input | Example value | Where your real number comes from |
|---|---|---|
| Monthly SEO cost | $3,000 | Agency invoice plus content and staff time |
| Non-branded organic visits to service and location pages | 900 | Search Console and GA4 |
| Share of those visits that call, fill a form or book | 4% | GA4 events and call tracking |
| Business Profile calls and booking clicks from non-branded searches | 24 | Business Profile performance and a profile-only call number |
| Share of new-patient contacts the team reaches | 70% | Call tracking: answered vs missed calls |
| Share of reached contacts who book | 55% | Front-desk call outcomes |
| Share of booked patients who attend | 85% | Practice management software |
These are example inputs we chose to show the math. They are not industry averages. For show rates, our dental no-show rate statistics give published figures to compare with yours.
Run the Example Model in Python
The model multiplies the steps together. Then it divides cost by the patients who reach the chair. We ran the same funnel for Google Ads, so both channels face the same front desk.
# EXAMPLE INPUTS: made up to show the math. Replace them with your own numbers.
SEO_COST = 3000      # monthly SEO cost: agency fee, content and staff time
VISITS = 900         # non-branded organic visits to service and location pages
VISIT_RATE = 0.04    # share of those visits that call, fill a form or book
GBP_CONTACTS = 24    # calls and booking clicks from the Business Profile, non-branded
ANSWERED = 0.70      # share of new-patient contacts the team reaches
BOOKED = 0.55        # share of reached contacts who book
SHOWED = 0.85        # share of booked patients who attend

AD_SPEND = 4000      # monthly Google Ads spend
AD_FEE = 600         # monthly ads management fee
CPC = 9.00           # average cost per click
CLICK_RATE = 0.08    # share of ad clicks that call, fill a form or book

def organic(cost=SEO_COST, visits=VISITS, rate=VISIT_RATE, gbp=GBP_CONTACTS, answered=ANSWERED):
    contacts = visits * rate + gbp
    patients = contacts * answered * BOOKED * SHOWED
    return patients, cost / patients

def paid(rate=CLICK_RATE, answered=ANSWERED):
    contacts = AD_SPEND / CPC * rate
    patients = contacts * answered * BOOKED * SHOWED
    return patients, (AD_SPEND + AD_FEE) / patients

levers = {
    "Answer more calls (70% to 85%)": dict(answered=0.85),
    "Fix service pages (4% to 5%)": dict(rate=0.05),
    "More Business Profile contacts (24 to 32)": dict(gbp=32),
    "New pages and links (+250 visits, +$400)": dict(visits=1150, cost=3400),
}
print("Organic start:", organic())
print("Paid start:", paid())
for name, change in levers.items():
    print(name, organic(**change))
print("All four levers:", organic(answered=0.85, rate=0.05, gbp=32, visits=1150, cost=3400))
print("Paid with the same phone fix:", paid(answered=0.85))
At the start, organic search produces 60 contacts a month: 36 from the website and 24 from the Business Profile. After the leaks, 19.64 new patients attend. So each one costs $152.79.
| Scenario | New patients a month | Cost per new patient |
|---|---|---|
| Organic, starting point | 19.64 | $152.79 |
| Answer more calls (70% to 85%) | 23.84 | $125.83 |
| Fix service pages (4% to 5%) | 22.58 | $132.86 |
| More Business Profile contacts (24 to 32) | 22.25 | $134.81 |
| New pages and links (+250 visits, +$400 a month) | 22.91 | $148.42 |
| All four levers together | 35.57 | $95.60 |
| Google Ads, starting point | 11.64 | $395.34 |
| Google Ads with the same phone fix | 14.13 | $325.57 |
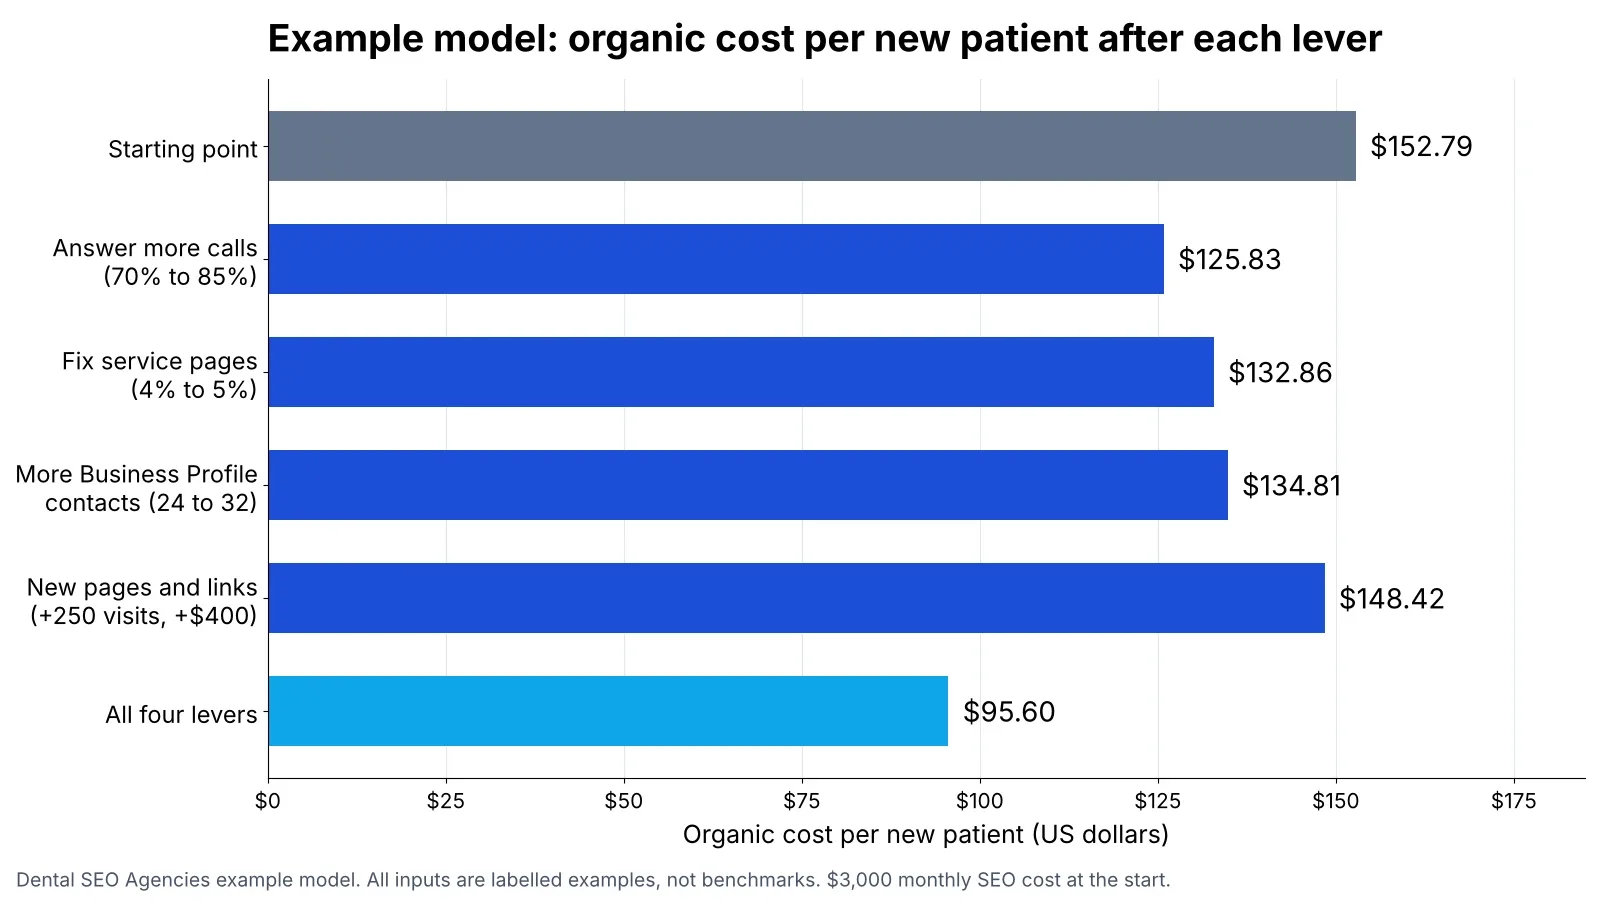
Look at the content lever. It adds more patients than the Business Profile lever, yet it saves the least per patient, because it raises the cost. New pages still earn their place. They just pay off best once the phone and the page stop leaking.
Put Organic and Paid Search Through the Same Funnel
In our example, Google Ads books 11.64 new patients for $4,600 a month. That works out at $395.34 each. Organic search costs less per patient here, but the gap depends entirely on the example inputs.
The more useful finding is the shared fix. The same answered-call rate feeds both funnels. So when the team reaches 85% of callers, the example ads cost falls to $325.57 per patient too.
For the wider budget question, our comparison of Google Ads and dental SEO covers timing, ad policies and how to split spend. Do your ads and organic visits land on one URL? Our guide to SEO and PPC landing pages explains when to split them.
Pull Six Levers That Cut Organic Cost per Patient
Each lever moves one input in the model. Work through them in this order, because the early ones are the cheapest.
Answer the Calls Organic Search Already Sends
A missed call is a patient you paid to attract and then lost. In our model, moving from 70% to 85% answered was the largest single saving.
So give organic visitors their own tracking number, and give the Business Profile another. Then tag every call as booked, not booked, missed, existing patient or spam. After a month, you will know how many new-patient calls ring out at lunch or after hours. The fix might be a lunch schedule, a call-back rule or a voicemail checked each hour.

Remove Friction From Service Pages
Next, look at the pages that get organic visits but few calls. The goal is to raise the share of visitors who make contact.
East River Dental in Newmarket, Ontario, builds its emergency page around that goal. Its H2s cover what counts as an emergency, what happens when you call and what to do while you wait. The phone number appears in the header, in buttons through the body and in a closing “Call Now” button. Office hours sit on the page, including evenings. It also has a cost section and lists direct insurance billing and 0% interest payment plans.
Copy that pattern on every service page. Put a tap-to-call number and a booking button on the first phone screen. Add your hours, the insurance you take and a plain answer on cost. Then answer the questions your front desk hears most, so fewer visitors leave to find answers elsewhere.
Fill Every Business Profile Field Google Uses
Google says businesses with complete and accurate information are more likely to show up in local search results. It names the full address, hours, special hours, category and attributes. It also says verified businesses are more likely to show up in search results.
Google ranks local results on relevance, distance and prominence. Distance is fixed by where your office sits. Relevance comes from how well your profile matches the search, so pick the right categories and add your services. Google also says there is no way to pay for a better local ranking. Our guide to the local 3-pack for dental clinics walks through each field.
Raise Review Count to Lift Prominence
Prominence is the factor reviews feed. Google says it is based partly on how many reviews you have and how many websites link to your business. It also says positive reviews and helpful replies make a business more noticeable.
So ask every attending patient, in person and by text, on the same day. Then reply to each review politely, and keep treatment details out of the reply. Our guide to getting more five-star dental reviews covers request timing and the rules on incentives.
Publish Service Pages for Searches You Miss
New pages bring new visits. However, they cost money, which is why they came last in our model. So build them where Search Console already shows impressions with no page to match.
Rodeo Dental and Orthodontics, with more than 50 offices in Texas, Colorado and Arizona, gives toothache its own page under emergency care. The page promotes same-day visits and names Medicaid, CHIP and major insurers. Then it links to coverage, financing and related treatments such as cavity care and cleanings. It also offers a Spanish version. So a patient searching “toothache” lands on a page about exactly that.
Point Internal Links at the Pages That Book
Internal links send visitors and Google to your best pages. Google says it uses links as a signal when it judges how relevant a page is, and to find new pages. It also says every page you care about should have a link from at least one other page on your site.
Use plain HTML links with descriptive anchor text, such as “dental implant costs.” Google lists “click here” as anchor text to avoid. Then link each blog post and symptom page to the service page that books the visit.
Rank the Levers by Cost per Patient Saved
Sort your own levers the same way. The cheapest fix with the largest drop goes first.
| Lever | Input it moves | Example change | Example cost per patient | Extra monthly cost in the example |
|---|---|---|---|---|
| Call tracking and call answering | Contacts reached | 70% to 85% | $125.83 | None |
| Service page fixes | Visit-to-contact rate | 4% to 5% | $132.86 | None |
| Business Profile fields and reviews | Profile contacts | 24 to 32 | $134.81 | None |
| New service pages and internal links | Non-branded visits | 900 to 1,150 | $148.42 | $400 |
| All four together | All of the above | All of the above | $95.60 | $400 |
The “None” entries leave out staff time. Add it if your team spends real hours on these fixes.
Measure Cost per Patient From Four Data Sources
No single tool holds the whole funnel. So pull one number from each source on the same day each month.
Count Non-Branded Clicks in Search Console
Open the Performance report and add a query filter. “Queries not containing” works for one brand term. For several, use “Custom (regex)” with “Doesn’t match regex” and list your practice and dentist names.
Search Console uses RE2 syntax, and regex matching is case-insensitive by default. However, Google warns that query filters can change totals, because anonymized queries are left out. So treat the filtered count as a trend line. Google also suggests weekly or monthly views to smooth out day-of-week swings.
Check the Organic Search Channel in GA4
GA4 puts a session in Organic Search in two cases. Either the source is on its list of search sites, or the medium is exactly “organic.” That matters for your Business Profile link. If you tag it with utm_medium=organic, those visits stay in Organic Search, and the campaign tag separates them.
Also pick the right channel dimension. Session default channel group credits the channel that started each visit. First user default channel group credits the channel that first brought the person to your site.
Tag Every Call by Outcome
Call tracking is the bridge between a visit and a patient. Keep separate numbers for the website’s organic visitors, the Business Profile and ads. Then report answered, missed and booked calls for each.
Take the Patient Count From Your Practice Software
The denominator belongs in the practice management system. Run the new patient report for the month, with the referral source field filled in at check-in. Count only patients who attended, and compare the total with what call tracking and GA4 suggest.
Report Patient Costs Without Sending Health Data to Trackers
Cost per patient needs only counts. So the safest report never sends patient-level data to an analytics or ad tool.
HHS defines a tracking technology as a script or code on a website or app. It gathers information about users or their actions. Its bulletin says trackers on pages behind a patient login generally have access to protected health information. It also says trackers on many public pages do not.
In June 2024, a federal court in Texas vacated part of that bulletin. The vacated part covered linking a person’s IP address with a visit to an unauthenticated public page. Still, HHS says a regulated practice must have a signed business associate agreement with any tracking vendor before PHI goes to it. A vendor’s promise to remove PHI after it receives it is not enough.
So build the monthly report from totals. Pull the new patient count from your practice software, and type it into the spreadsheet by hand. Keep analytics tags off patient portals, and never pass names or treatment reasons into GA4 events. Our ROI guide covers the call recording side in more detail.
Split Cost per Patient by Treatment and Office
One blended number can hide a cheap channel and an expensive one. So split cost per patient by service line once you have three months of data.
For example, emergency pages often bring callers who book that day. Implant pages bring fewer patients, each worth far more. A higher cost per implant patient can still be the better deal.
Groups should split by office too. Each office has its own Business Profile, its own phone line and its own local competition. Our guide to multi-location dental SEO covers per-office tracking.
Questions Owners Ask About Cheaper Organic Patients
What Is a Good Cost per New Patient From Organic Search?
There is no fair national number, because fees and margins differ by practice. Compare your organic figure with your own paid search figure and with what a new patient is worth to you.
Should Patients Who Searched Our Name Count?
Keep them in a separate line. They came through Google, but your reputation sent them. Counting them makes SEO look cheaper than it is.
How Fast Do These Levers Show Up in the Numbers?
Phone fixes show up within weeks, because the calls already exist. Service page fixes need enough visits to measure. New pages take longest, because they have to rank first.
Does Cutting the SEO Budget Lower Cost per Patient?
Only for a while. Rankings can slip once the work stops, and the patient count falls with them. Fix the leaks first, then judge the budget on the new number.
Fix the Cheapest Leak Before Next Month’s Report
Pick one lever this week. For most practices, that is the phone, because it costs nothing and the calls are already coming in. Then rerun the model with your real numbers next month. Want an agency to handle the page and profile work? Request quotes from dental SEO agencies, and ask each one how it reports cost per patient.